NASA Announces Summer 2023 Hottest on Record

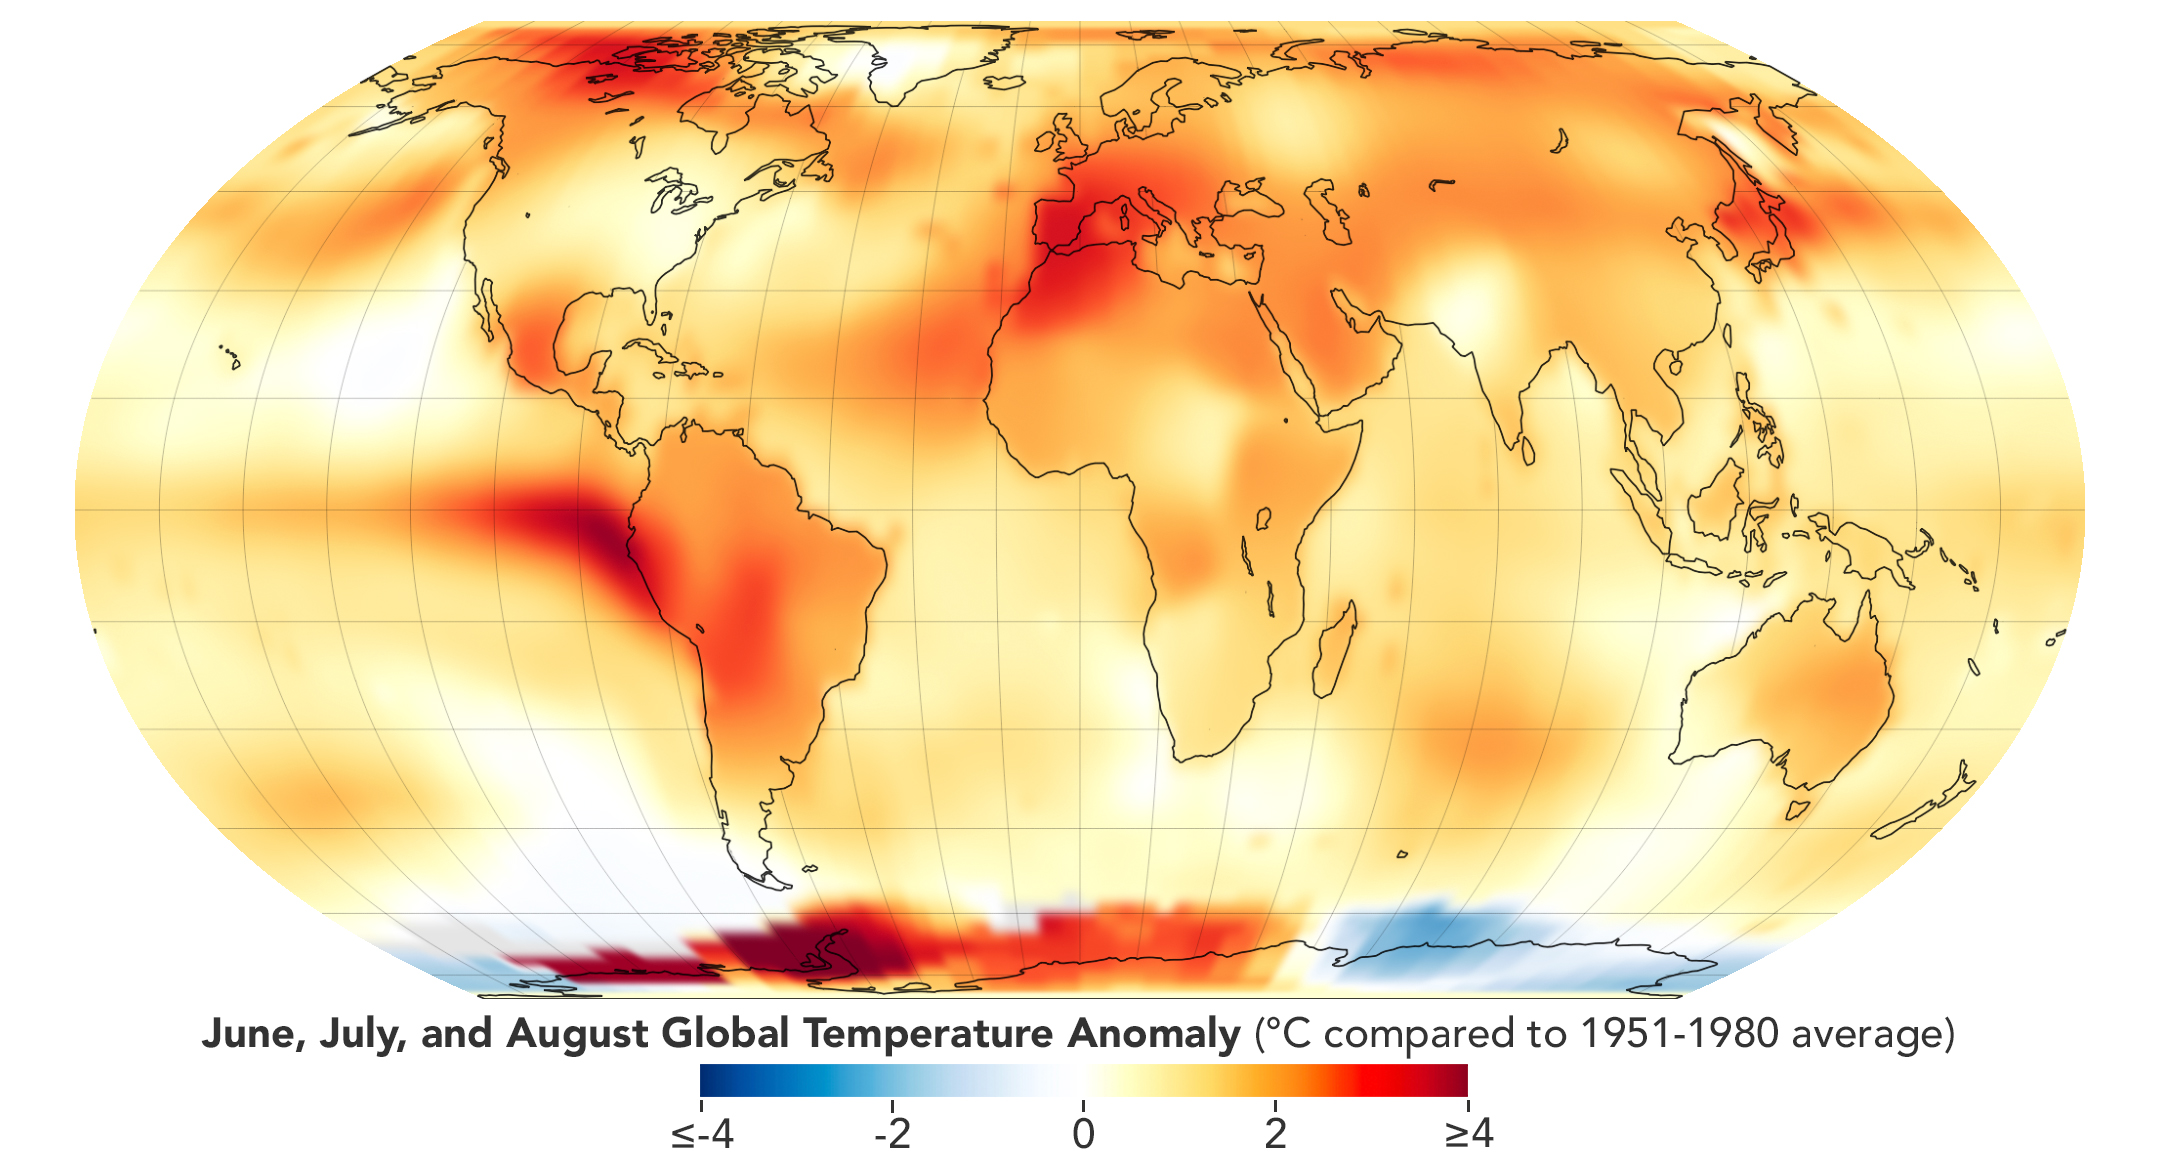
Summer of 2023 was Earth’s hottest since global records began in 1880, according to scientists at NASA’s Goddard Institute of Space Studies (GISS) in New York.
The months of June, July, and August combined were 0.41 degrees Fahrenheit (0.23 degrees Celsius) warmer than any other summer in NASA’s record, and 2.1 degrees F (1.2 C) warmer than the average summer between 1951 and 1980. August alone was 2.2 F (1.2 C) warmer than the average. June through August is considered meteorological summer in the Northern Hemisphere.
This new record comes as exceptional heat swept across much of the world, exacerbating deadly wildfires in Canada and Hawaii, and searing heat waves in South America, Japan, Europe, and the U.S., while likely contributing to severe rainfall in Italy, Greece, and Central Europe.

“Summer 2023’s record-setting temperatures aren’t just a set of numbers – they result in dire real-world consequences. From sweltering temperatures in Arizona and across the country, to wildfires across Canada, and extreme flooding in Europe and Asia, extreme weather is threatening lives and livelihoods around the world,” said NASA Administrator Bill Nelson. “The impacts of climate change are a threat to our planet and future generations, threats that NASA and the Biden-Harris Administration are tackling head on.”
NASA assembles its temperature record, known as GISTEMP, from surface air temperature data acquired by tens of thousands of meteorological stations, as well as sea surface temperature data from ship- and buoy-based instruments. This raw data is analyzed using methods that account for the varied spacing of temperature stations around the globe and for urban heating effects that could skew the calculations.
The analysis calculates temperature anomalies rather than absolute temperature. A temperature anomaly shows how far the temperature has departed from the 1951 to 1980 base average.
“Exceptionally high sea surface temperatures, fueled in part by the return of El Niño, were largely responsible for the summer’s record warmth,” said Josh Willis, climate scientist and oceanographer at NASA’s Jet Propulsion Laboratory in Southern California.
El Niño is a natural climate phenomenon characterized by warmer than normal sea surface temperatures (and higher sea levels) in the central and eastern tropical Pacific Ocean.
The record-setting summer of 2023 continues a long-term trend of warming. Scientific observations and analyses made over decades by NASA, National Oceanic and Atmospheric Administration (NOAA), and other international institutions have shown this warming has been driven primarily by human-caused greenhouse gas emissions. At the same time, natural El Niño events in the Pacific pump extra warmth into the global atmosphere and often correlate with the warmest years on record.
“With background warming and marine heat waves that have been creeping up on us for decades, this El Niño shot us over the hump for setting all kinds of records,” Willis said. “The heat waves that we experience now are longer, they’re hotter, and they’re more punishing. The atmosphere can also hold more water now, and when it’s hot and humid, it’s even harder for the human body to regulate its temperature.”
Willis and other scientists expect to see the biggest impacts of El Niño in February, March, and April 2024. El Niño is associated with the weakening of easterly trade winds and the movement of warm water from the western Pacific toward the western coast of the Americas. The phenomenon can have widespread effects, often bringing cooler, wetter conditions to the U.S. Southwest and drought to countries in the western Pacific, such as Indonesia and Australia.
“Unfortunately, climate change is happening. Things that we said would come to pass are coming to pass,” said Gavin Schmidt, climate scientist and director of GISS. “And it will get worse if we continue to emit carbon dioxide and other greenhouse gases into our atmosphere.”
NASA’s full temperature data set and the complete methodology used for the temperature calculation and its uncertainties are available online.
GISS is a NASA laboratory managed by the Earth Sciences Division of the agency’s Goddard Space Flight Center in Greenbelt, Maryland. The laboratory is affiliated with Columbia University’s Earth Institute and School of Engineering and Applied Science in New York.
For additional figures and maps related to this announcement, visit:
https://svs.gsfc.nasa.gov/14407
News Media Contacts
Karen Fox/Aries Keck
Headquarters, Washington
202-358-1100
karen.fox@nasa.gov/aries.keck@nasa.gov
Jacob Richmond
Goddard Space Flight Center
301-286-6255
jacob.a.richmond@nasa.gov

Comments